Plot Controls
FrackOptima contains 2D and 3D plots to help visualize input parameters, such as the reservoir layer and injection locations. Plots are also used to present simulation results. The plots are designed to be interactive, and this section will help you understand how to control the plots.
2D Plots
2D plots are used to visualize the reservoir formation and pumping schedule, and also to present line result data from the simulator.
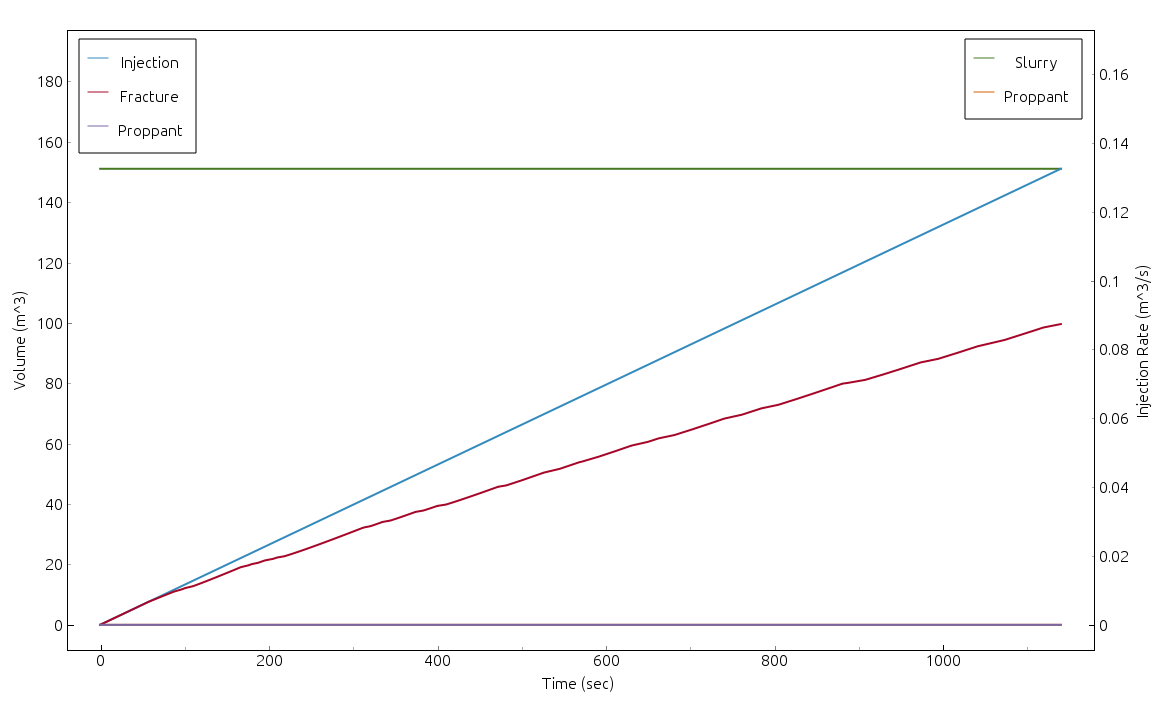
Figure 1: Example 2D Plot
Movement
| Left Mouse: Hold | Pan view |
| Right Mouse: Hold | Zoom based on mouse direction |
| Right Mouse: Click | Context menu |
| Scroll Wheel | Zoom axes equally |
- Panning: Holding the left mouse button and moving the mouse in the central plot area pans the view. If the mouse is over an axis (near the axis label), the view is panned with respect to that axis.
- Zooming: Holding the right mouse button or scrolling the scroll
wheel will zoom the plot. There are different ways to zoom:
- Central plot area: If the mouse pointer is in the central plot area, then the scroll wheel will zoom each axis equally. With the right mouse button held down, moving the mouse left/right will zoom the x-axis, and moving the mouse up/down will zoom the y-axis.
- Axis label: If the mouse pointer is over an axis label, then zooming only applies to that axis.
- Context Menu: Right clicking in the central plot area will open a context menu. See the Context Menu section.
Note
The reservoir plots have a linked y-axis, and the x-axis is restricted. This means you cannot zoom or pan in the x-axis direction. These plots also do not have a context menu; they are controlled with the Plot Properties tab.
3D Plots
3D plots are used to visualize the wellbore geometry and injection locations, and also to visualize the fractures from the simulation.
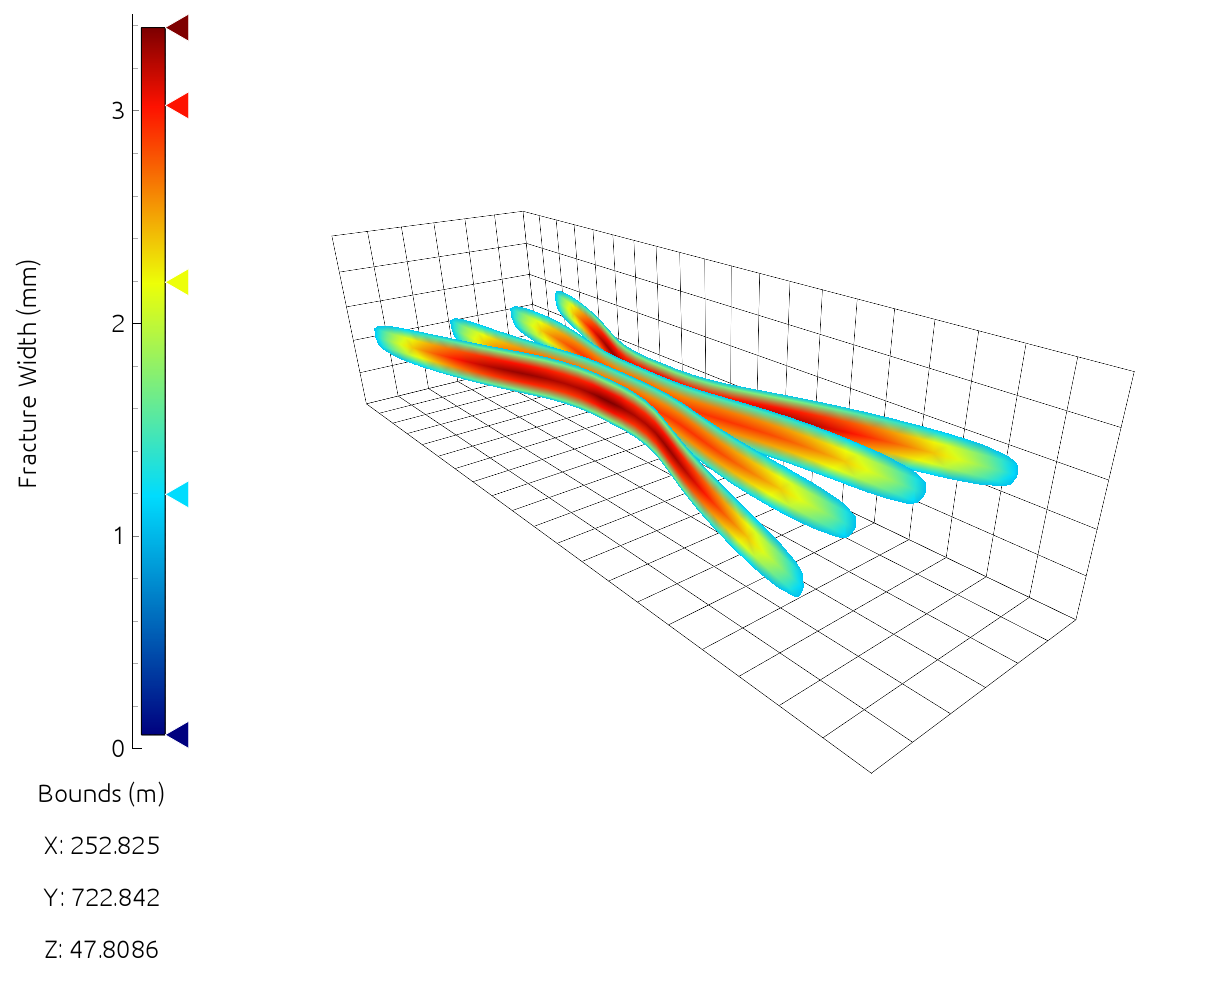
Figure 2: Example 3D Formation Plot
Movement
| Left Mouse: Hold | Rotate camera |
| Right Mouse: Hold | Pan in plane |
| Right Mouse: Click | (Click on axis) Context menu |
| Scroll Whell: Click/Hold | Pan on XY plane |
| Right/Left Mouse: Hold | Zoom camera |
| Scroll Wheel | Zoom camera |
- Rotating: Holding the left mouse button and moving the mouse will rotate the view about the camera’s focus location.
- Panning: Holding the right mouse button or scroll wheel will pan the camera’s focus. The right mouse button pans along the current view plane, and the mouse wheel pans along the XY plane.
- Zooming: Scrolling the mouse wheel or holding the left and right mouse buttons will zoom the camera.
- Context Menu: Right clicking above the axis label to the left of a formation 3D plot will open the context menu. See the Context Menu section.
Context Menu
Right clicking the axis of a formation plot (see Example 3D Formation Plot) will popup a context menu.
- Units/Labels: Pops up a dialog where the user can edit the label and units for the axis. Units can be typed by the user if they are not present in the drop down menu. Invalid units are ignored.
- Set Background: Can set the background to either light or dark.
- Export: Opens save dialog to export the plot as a .png file.
Colorbar
There is a colorbar next to the axis on 3D formation plots. Here is a summary of how to use the colorbar.
- You can move the triangles by left clicking and holding them.
- Left click a triangle to edit its color.
- Right click a triangle to delete it.
- Left click on an empty area to add a triangle.
- Right click the colorbar to select a predefined color scheme.
Modifying the triangles is useful because it changes the color gradient, and helps you accent certain ranges of the plotted variable.
Bounds
Below the axis and colorbar is a list of Bounds, where the lengths of the bounding box sides of the fractures is shown. The bounds can be shown or hidden using the 3D Item Selection Tree in the Formation Plots toolbox.