Tables
Tables are the primary method of specifying data in FrackOptima. Although the various tables in FrackOptima represent different data, they are presented with a consistent interface. This section explains how to manipulate tables.
Editing
A user can edit a cell by double clicking, entering the value, and hitting
Enter or clicking another part of the UI. If not editing, the arrow keys will
move the cell selection. When entering decimal values, it is alright to use
scientific notation. For example, 1e3 represents 1000, and 1e-3
represents 0.001. If the full decimal representation of a number is too
long, it will be shortened using scientific notation once inputted.
Warnings/Errors
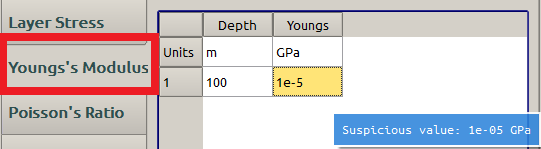
Figure 1: An example of a warning indicator
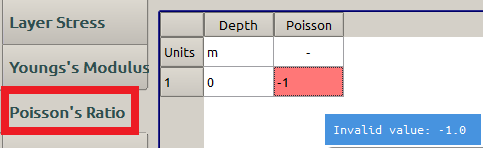
Figure 2: An example of an error indicator
Most values in tables are physical quantities that have a specific physical meaning. As such, these values must be in a certain range. For example, Poisson’s Ratio must be between 0 and 0.5. Some values may also be inputted erroneously, especially if the user was thinking in the wrong units. It is common to input a Young’s Modulus of 10 Pa, when the user really meant 10 GPa.
In order to help identify issues such as this, FrackOptima will warn the user by highlighting values that are invalid or suspicious, as in Figure 1 and Figure 2. Hold your mouse over a highlighted item to see a popup explaining what the problem is. Note that the simulator will not run if an errors are present in the current project.
Unit Conversions
The first row of columns that represent dimensional quantities is the units row. Clicking on the units row will pop up a drop down menu with which to select alternate units for that column. This is useful if a user is more comfortable with another units system, or if the data being inputted is not in SI units. Additionally, the user can type units into the edit box. If the units are valid, then the row will be converted to those units.
Adding and Removing Rows
The plus and minus sign buttons are for adding and removing rows, respectively. If no row is selected, then adding a row will duplicate the last row in the table and append it to the end. If any part of a row is selected, then that row will be copied and the new row will be prepended to the selection. Selecting one or more rows and pressing delete will delete those rows.
Copy and Paste
If a range of cells is selected, a user can right click and select Copy from
the context menu to put those cells on the clipboard. Alternatively, one can
also use the standard shortcut control-c. The copied data can be copied to
any text format, or another spreadsheet program.
Of course, tabular data from another program can be pasted into FrackOptima,
either by selecting Paste from the context menu or using the keyboard shortcut
control-v.
Note
Spreadsheet programs implement copy and paste differently. As such, copy and paste my be inconsistent when copying from another program to FrackOptima, and vice versa.
Table Buttons
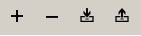
Figure 3: Buttons present above each table.
These buttons are present above every table. They perform the following functions:
- Add a row
- Remove rows
- Import
- Export as a CSV file
The details of “Import” and “Export” actions are here.
See also
- Individual Table IO
- For more information on how to import and export individual tables.