Plot Unit Profiles
Profile Selection
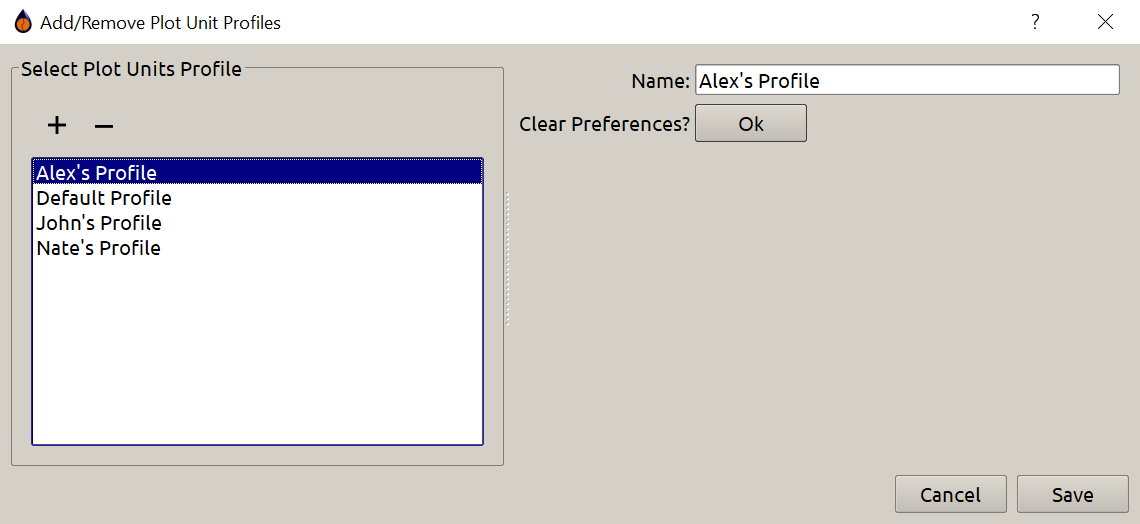
Plot Profiles are used to automatically keep track of the units for data analysis plots. To switch to a different plot profile or to create a new one, navigate to Options -> Plot Unit Profiles. There you will see: the available plot unit profiles, the ability to create a new profile, and the ability to reset the currently selected profile to use the default units. The current profile will be check marked in the list of available profiles. Figure 1 illustrates these steps.
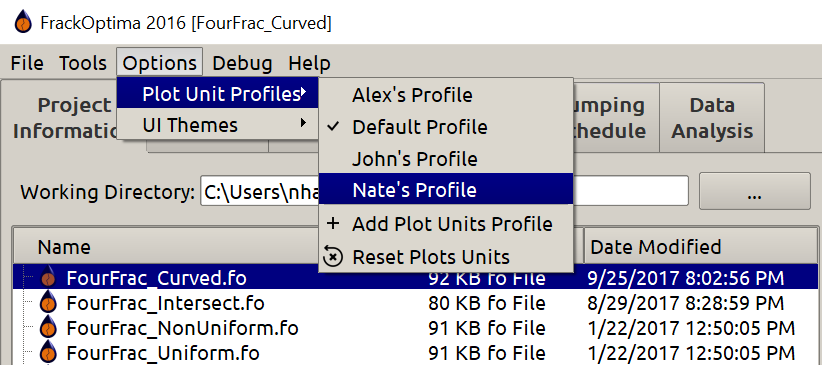
Figure 1: Plot Profile Selection
Plot Unit Changing
Plot Unit Saving currently only works for data analysis plots. To change the units on a plot, right click anywhere on the graph besides the plot like on the x-axis or y-axis. This should bring up a menu with several options. Now click Units/Labels... to launch the Change Units/Labels popup. This should create a view that will allow you to change the available units for a plot. It should resemble something similar to Figure 2. The changes made for any of these units will load anytime that particular plot is used.
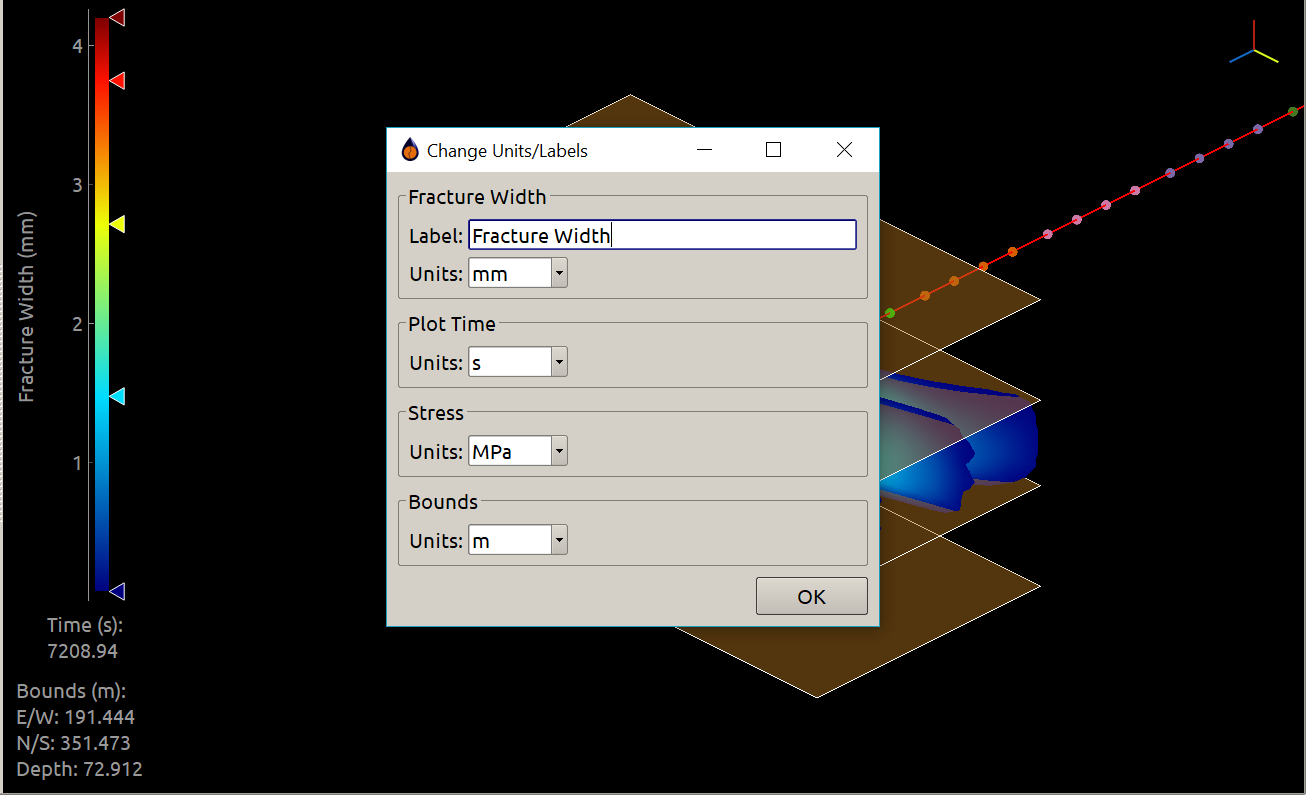
Figure 2: Changing Units on Plots